

Driving E-commerce Growth Through Strategic Research
A research-driven initiative to optimize the Product Details Page (PDP) experience for a fashion e-commerce platform, translating qualitative insights into validated design improvements that increased conversion and revenue per session.

TL;DR
I co-led the research strategy for optimizing Youcom's Product Details Page during the Upstream cycle, facilitating user interviews with 8 customers and synthesizing insights through affinity mapping and behavioral analysis. This research shaped the product roadmap for Q1 2023, generating three prioritized hypotheses ranked by user impact and business value. I structured the synthesis methodology—coding user journeys by participant, mapping insights to page sections, and translating observations into testable hypotheses—creating alignment between design, product, and engineering teams.
During the Downstream cycle, I transitioned to sole designer for the photo gallery redesign (Hypothesis #2), owning the end-to-end design process from exploration through A/B testing. This resulted in a 7.6% increase in revenue per session and 5.6% conversion rate uplift, validated through rigorous testing before full rollout in Q2 2023. By framing research outputs as actionable hypotheses and establishing clear success metrics, we enabled the organization to make confident, data-backed investments while creating a reusable research framework for future product initiatives.
Role: Product Designer
• Upstream: Collaborative Research Lead
• Downstream: Solo Designer
Timeline: Q4 2022 – Q2 2023 (~6 months)
Team: 2 Product designers, UX Writer, Product Owner, Engineering Team
Impact:
• +7.6% revenue per session
• +5.6% conversion rate
• +R$397K projected incremental revenue for 2023
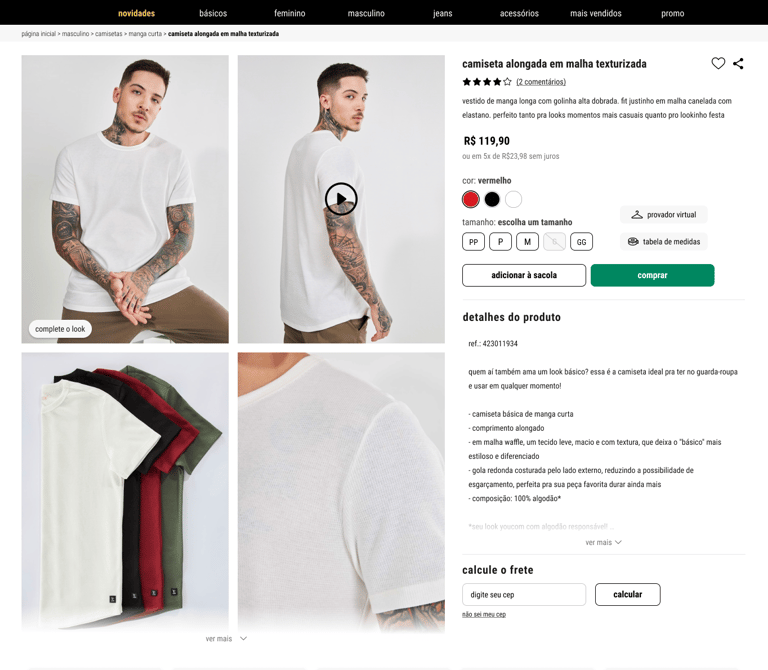
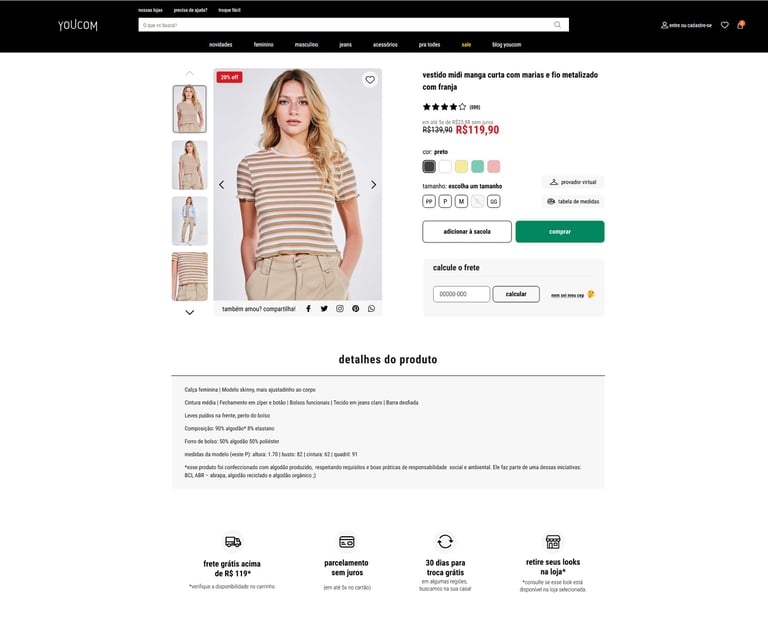
Previous version of the PDP interface
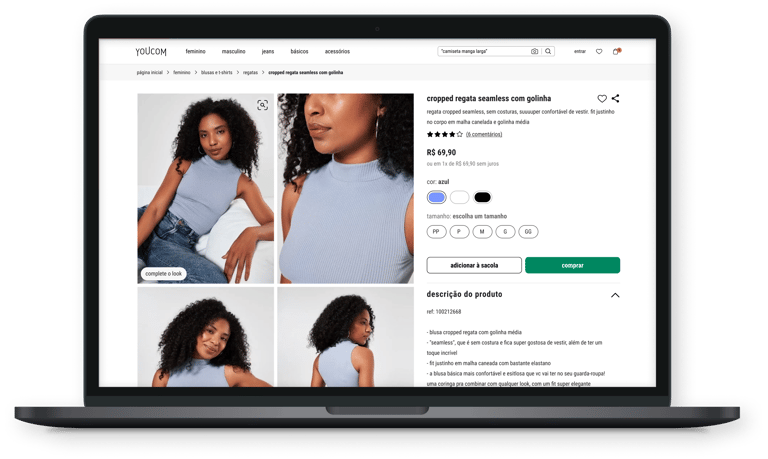
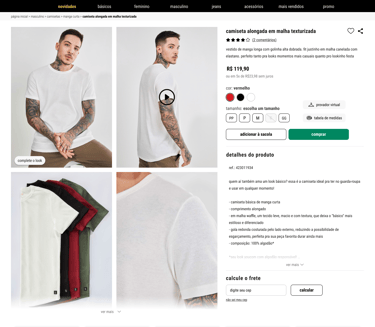
Updated PDP interface after UX and UI improvements
Goals:
Uncover qualitative insights explaining user behavior patterns
Prioritize conversion blockers by impact and business value
Generate validated hypotheses aligned with quarterly OKRs
Reduce friction in product exploration and decision-making
Establish repeatable research framework for future iterations
Validate changes through A/B testing before rollout
Problem Framing
Context
Youcom, a fashion and youth lifestyle brand, operates across digital and physical channels. The Product Tribe focused on evolving the e-commerce experience during the exploration and consideration phases of the customer journey. The Product Details Page represented a critical conversion touchpoint, yet performance metrics indicated underutilization of key page elements.
The company had access to quantitative data - heatmaps, click analytics, abandonment rates- but lacked qualitative insights to interpret user behavior. This gap limited confident prioritization. Additionally, the PDP had evolved organically without cohesive information architecture, resulting in inconsistent experiences across desktop and mobile. Market pressures from competitors with engaging visual experiences, combined with internal OKRs focused on digital conversion, created urgency to address friction points systematically.
Problem & Objectives
The PDP was underperforming despite high traffic and purchase intent. Users weren't engaging with critical content—product details were viewed by only 50% of desktop users and 35% of mobile users, while cross-selling showcases reached as low as 10-15% of the audience. Without qualitative validation, we risked investing resources in the wrong solutions.
The business needed a research-driven roadmap that could identify high-impact opportunities and validate assumptions before development. For users, the experience needed to surface relevant information more effectively and reduce cognitive load during decision-making. Constraints included limited engineering capacity, quarterly planning cycles, and technical dependencies from legacy systems.
My Role
I co-shaped the research strategy during the Upstream cycle, influencing how we framed uncertainty through the CSD Matrix to start with aligned assumptions rather than scattered questions. I pushed for a hybrid research approach to triangulate insights and avoid confirmation bias. During synthesis, I structured the debrief methodology that translated raw observations into prioritized, testable hypotheses, creating the translation layer between research and product backlog. I identified the risk of pursuing Hypothesis #3 without sufficient validation, leading to strategic deferral rather than overcommitting resources. For Hypothesis #2, I transitioned to sole designer during Downstream, owning end-to-end design from exploration through A/B test validation, while ensuring cross-functional alignment with engineering and establishing clear success metrics.
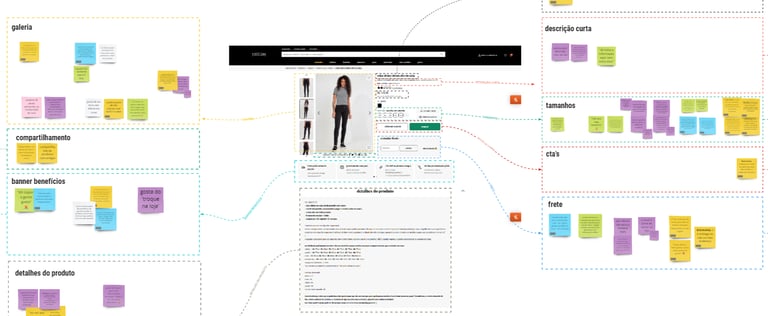
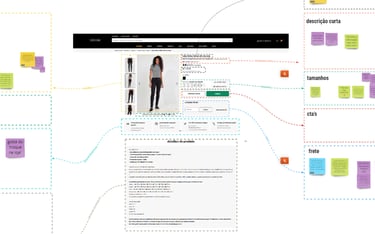
PDP breakdown highlighting findings from research and UX audit
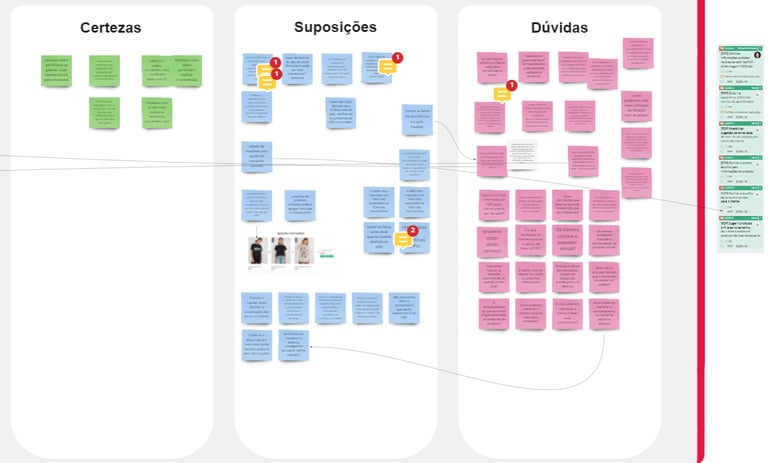
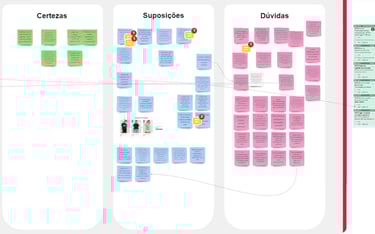
CSD matrix connecting roadmap initiatives to Kanban cards for team alignment
Design process
Discovery & Framing
The team initiated with a CSD Matrix to surface assumptions and knowledge gaps. This collaborative Miro artifact created shared understanding of what we knew (business goals, OKR targets), what we believed but couldn't prove (user preferences, pain points), and what remained uncertain. The Doubts column became our research question backlog.
I led desk research and competitive benchmarking to understand industry patterns in PDP design for Gen Z fashion e-commerce. Through Hotjar session recordings, I observed rage clicks, hesitation patterns, and navigation flows, correlating these with heatmap data showing engagement drop-offs. This revealed that critical product information fell below the average fold for 50-65% of users, and cross-selling elements were rarely viewed.
Findings were synthesized into an affinity map that clustered pain points by theme, informing our user interview script. The script balanced open-ended questions about shopping behavior with targeted prompts about the current PDP, capturing both attitudinal and behavioral data.
Exploration & Validation
The team conducted 8 remote user interviews over 2 weeks, evenly split between desktop and mobile users. After conversation, participants completed a moderated usability test of the live PDP. I documented journeys using screenshots and color-coded observations to track patterns and identify shared friction points.
Debrief synthesis involved recreating user journeys on Miro with post-its capturing quotes and critical moments. The team mapped insights to PDP sections using frequency-based ranking (red dots for user impact, blue dots for design bets). This generated three testable hypotheses:
Hypothesis #1 (Quick Win): Repositioning rating stars higher on the page would increase interaction with product reviews
Hypothesis #2 (High Value, High Effort): Redesigning the photo gallery to display all images openly would improve engagement and reduce cognitive load
Hypothesis #3 (Further Research Needed): Breaking product descriptions into scannable sections would help users find key information faster
For Hypothesis #2, I explored low-to-mid fidelity layouts through sketches and design critiques, then refined the strongest direction into high-fidelity prototypes with stakeholder alignment and early technical feasibility validation with engineering.
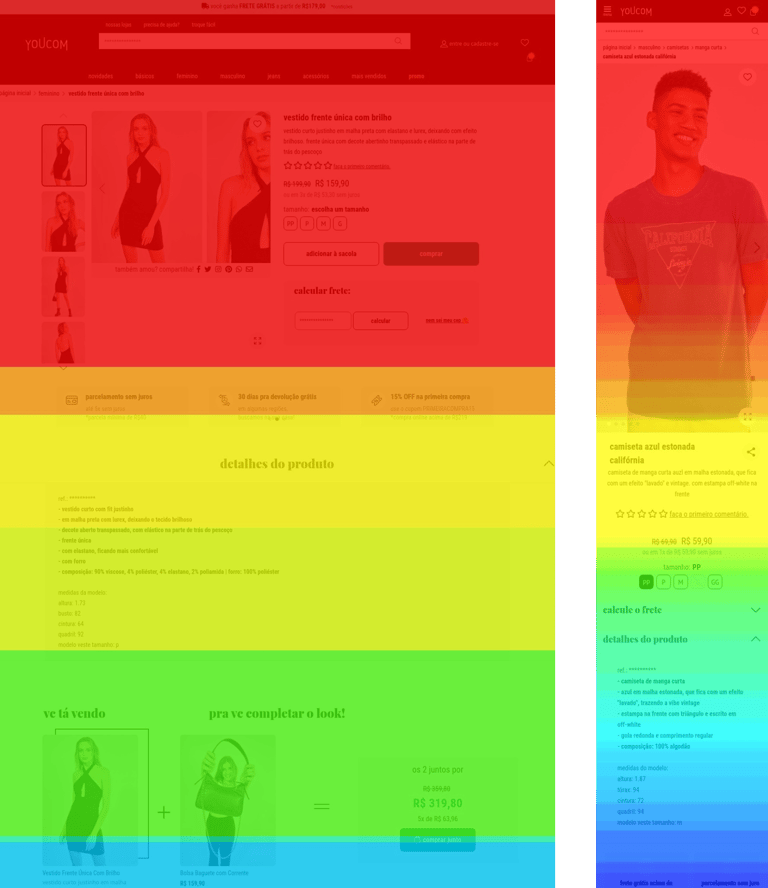


Heatmap collected on Hotjar
User interviews conducted remotely

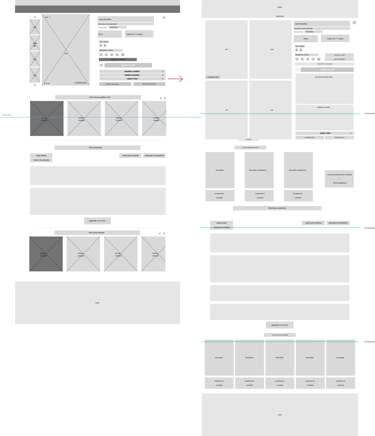
Wireframe concepts for the PDP
High-Fidelity Design & Testing
I owned final design execution for Hypothesis #2, creating an open gallery layout that displayed all product images vertically, eliminating carousel navigation friction identified during research. I designed interaction states (hover, zoom, image selection), optimized for responsive breakpoints, and ensured design system consistency while introducing new components.
The solution was documented with user stories and acceptance criteria covering edge cases (missing images, varying aspect ratios, slow load states). A 4-week A/B test (March–April 2023) compared the new gallery against the control, with weekly monitoring of success metrics.
Impact & Outcomes
The redesigned photo gallery delivered measurable business value:
+7.6% revenue per session at 95% confidence, translating to stronger monetization per visitor
+5.6% conversion rate uplift at 91% confidence, indicating improved purchase intent
+R$397K projected incremental revenue for 2023, validating the investment in this initiative
100% traffic rollout in Q2 2023 following successful A/B test validation
Beyond direct metrics, the research framework established during the Upstream cycle became a repeatable model for other squads. The CSD Matrix, affinity mapping, and hypothesis prioritization approach were adopted across the Product Tribe, accelerating future discovery work. Deprioritized hypotheses (H#1, H#3) were documented in a shared research repository, enabling other teams to revisit them without duplicating research effort.
Internal feedback from the Product Owner and engineering team emphasized the clarity of deliverables - acceptance criteria, user stories, and feasibility validation - which reduced back-and-forth during implementation and minimized scope creep.
Let's collaborate!
Contact me
Based in Paris, I’m open to remote or hybrid permanent roles. I bring expertise from SaaS B2B and B2C companies across early-stage, growth, and mature environments, helping teams design impactful products.